Our Results

Analysis of the east region of Lake Como through Landslide Susceptibility Mapping

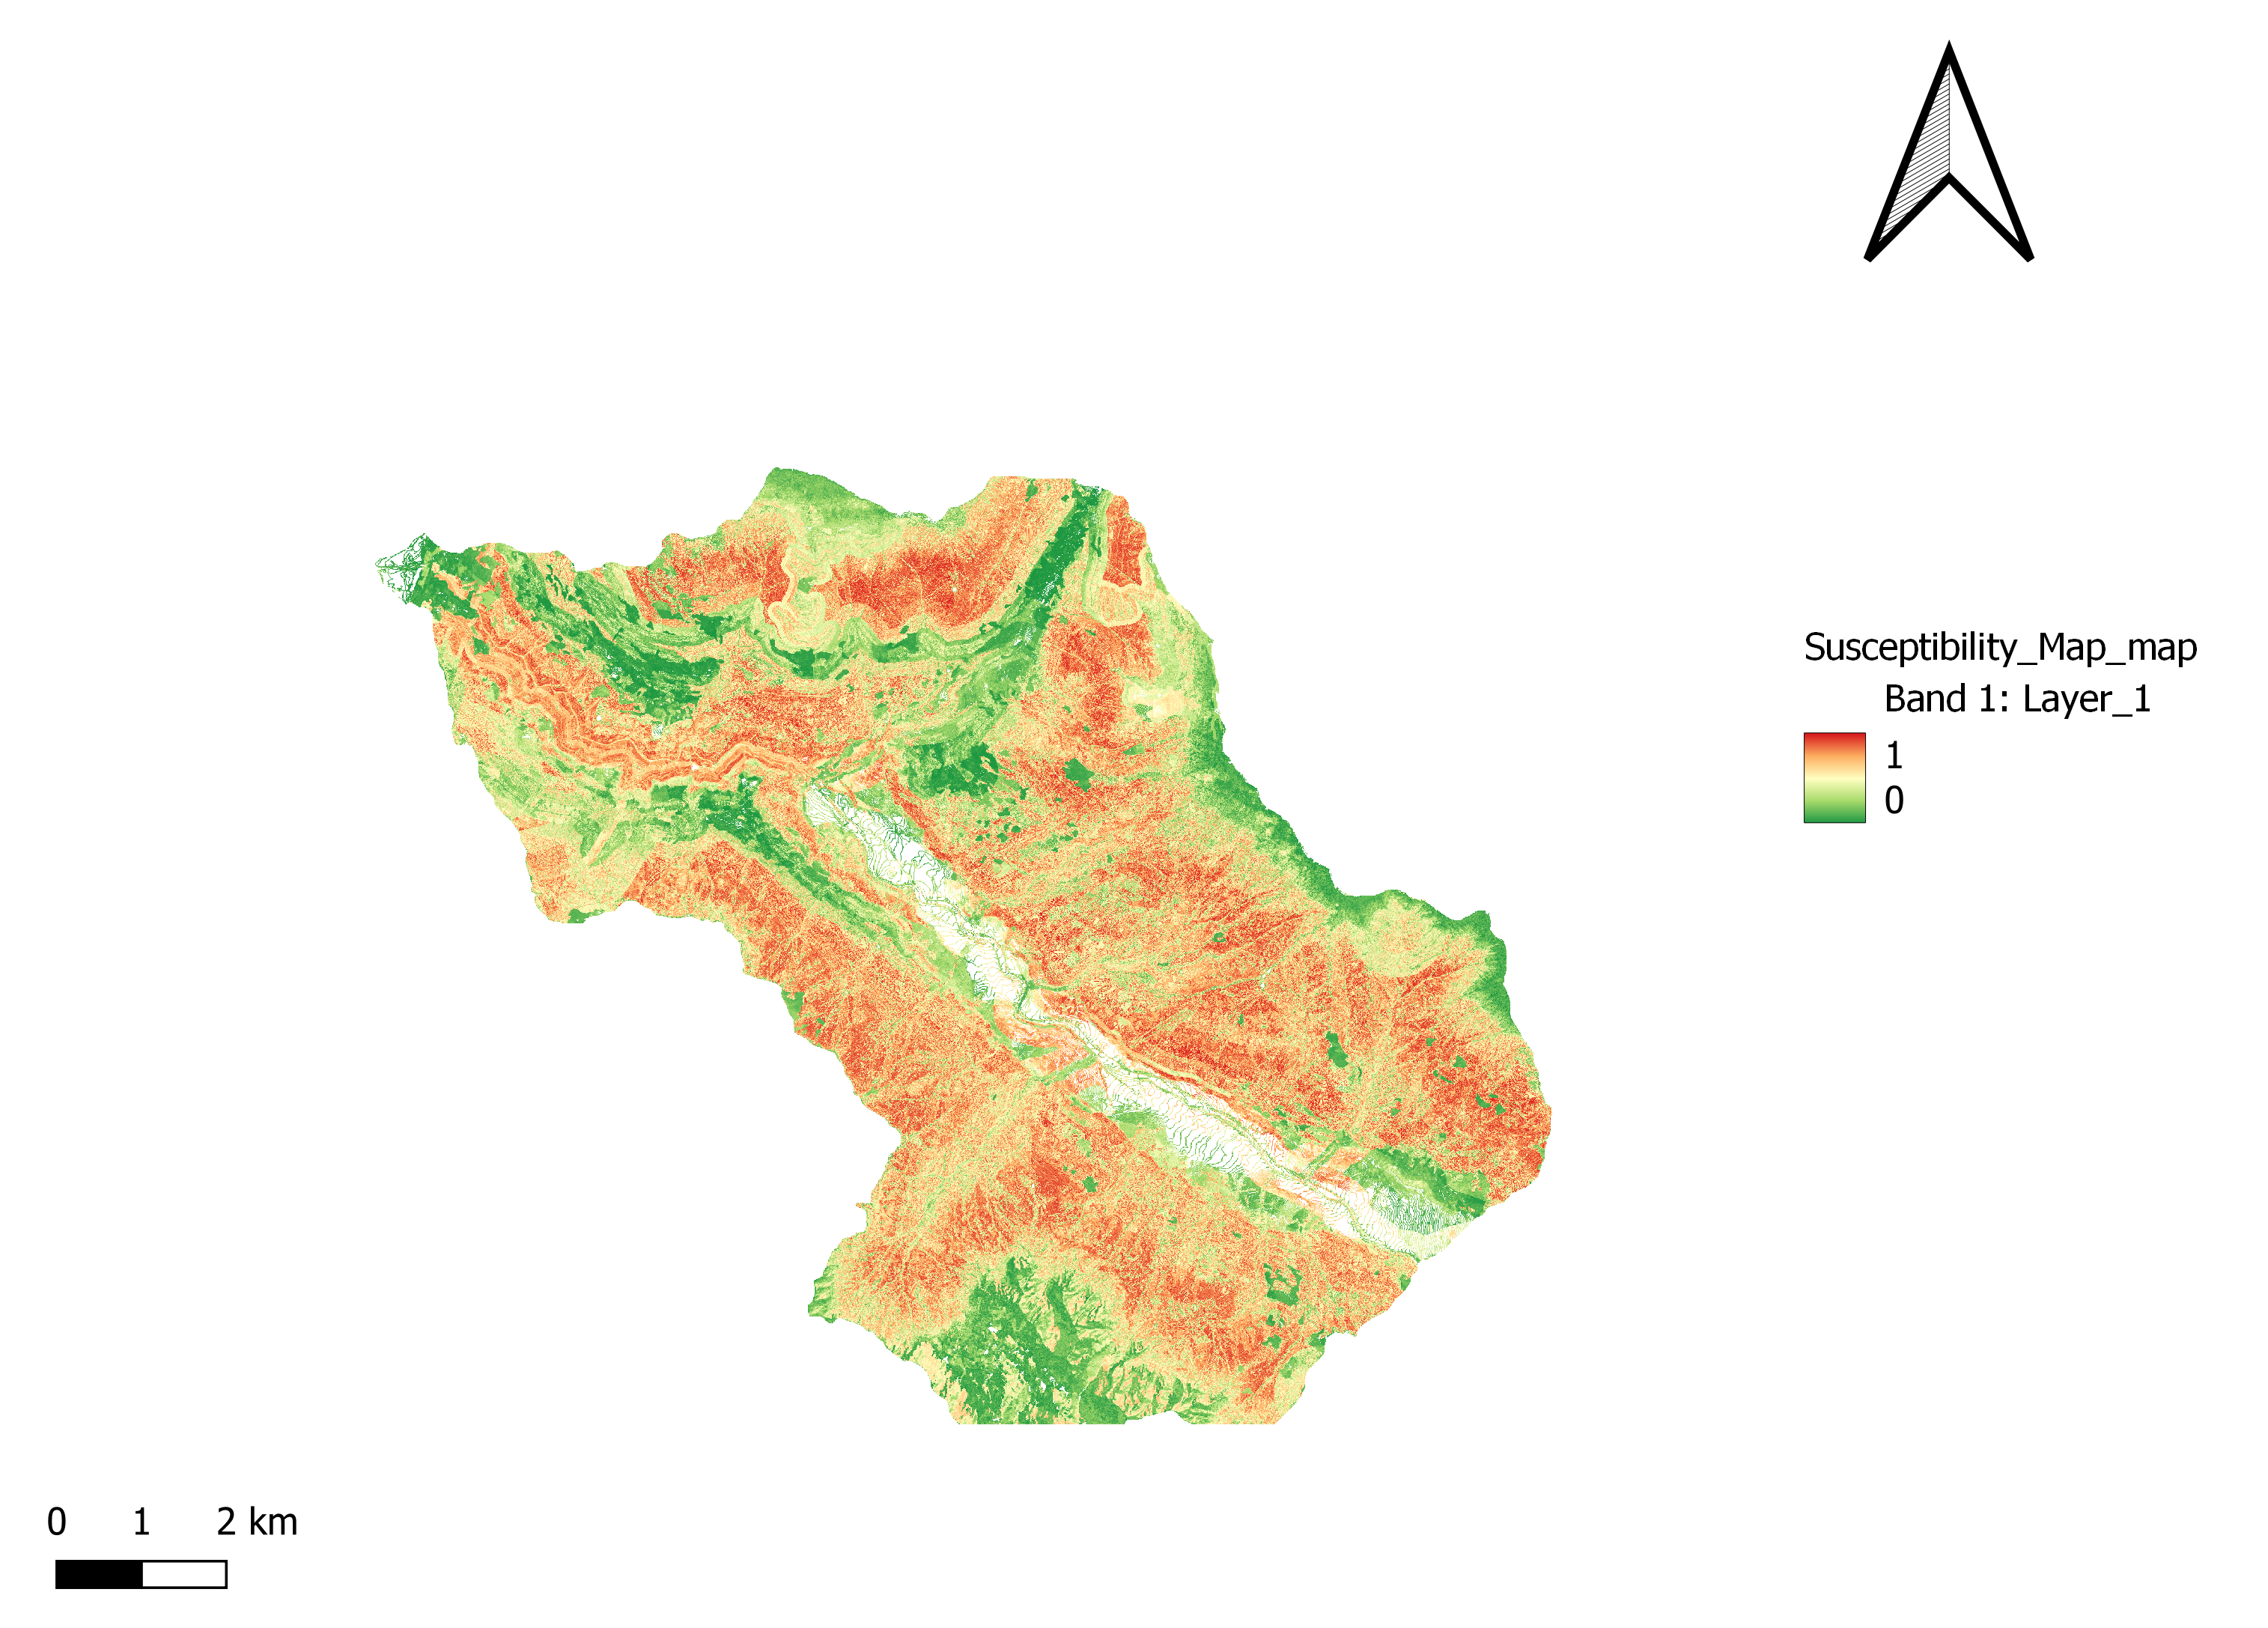
From the map we can see that the level of landslide risk is greater on the sides of the river in the center of the area, and decreases instead on the boundaries of the analyzed area as the distance from the river banks increases.
This can happen because riverbanks are often subject to erosion, which can weaken the soil and make it more susceptible to landslides; in addition, the infiltration of water into the soil makes it less cohesive and therefore less resilient.

The error matrix that we have obtained from the validation procedure is the following:


The overall accuracy (OA), represents the proportion of correctly classified pixels out of the total number of pixels assumes the value of 0.77. This accuracy corresponds a sufficiently high level of reliability in the results of the susceptibility map.

Producer’s accuracy (PA) of a class is probability that the class present on the ground is also captured by the classification in the thematic raster. The model has a high accuracy (0.95) in predicting Class 0 instances and a relatively lower accuracy (0.61) in predicting Class 1 instances. This suggests that the model is more accurate in identifying instances belonging to Class 0 compared to Class 1.

User’s accuracy (UA) of a class shows how often a user of classified map can expect to find the class on the ground. The model has a higher accuracy (0.93) in predicting Class 1 instances compared to Class 0 (0.68). It implies that when the model predicts an instance as Class 1, it is more likely to be correct (93% of the time), while the accuracy is relatively lower (68%) when the model predicts an instance as Class 0.

Conclusions

The pie chart shows that most people (62.6%) live in areas with low landslide risk. Only a small percentage of people (15.7%) live in areas with a very high landslide risk. This means that most people are relatively safe from landslides. However, it is important to note that even areas with low landslide risk can be affected by landslides if extreme weather conditions occur.

Issues

In the process of working on our project we encountered some problems that slowed down our workflow.

  • We faced difficulties in generating the susceptibility map. We had to ensure that all the required layers had the same extent and pixel dimensions. In order to do that we had to use the tool r.resamp.
  • The susceptibility map is missing a small portion. We tried generating it several times and also using different sets of training points from different PCs, but the problem remained unresolved.
  • Some team members were unable to continue the process of generating the error matrix on their PCs because they lacked the "Accuracy Assessment and Sampling" tool, that we were not able in any way to install.
  • We had to find an alternative approach (Flourish) to plot the pie chart showing the percentage of the population residing in the four different risk classes. The only team member who had access to the "Accuracy Assessment and Sampling" functionality and successfully completed the QGIS requirements encountered problems with the DataPlotly plugin. Despite selecting "pie chart" from the menu, only a solid-colored line was plotted.
  • It was impossible for us to set up bing basemaps in our webgis map, as with three different computers and three different accounts we were unable to get a bing key. The dedicaded website did not allow us to fill out the form to get the key, returning only the wording "Failed to get keys".
  • We had some difficulties in setting checkboxes in our webgis map. Such tools, in fact, conflicted with the CSS of the initial template.